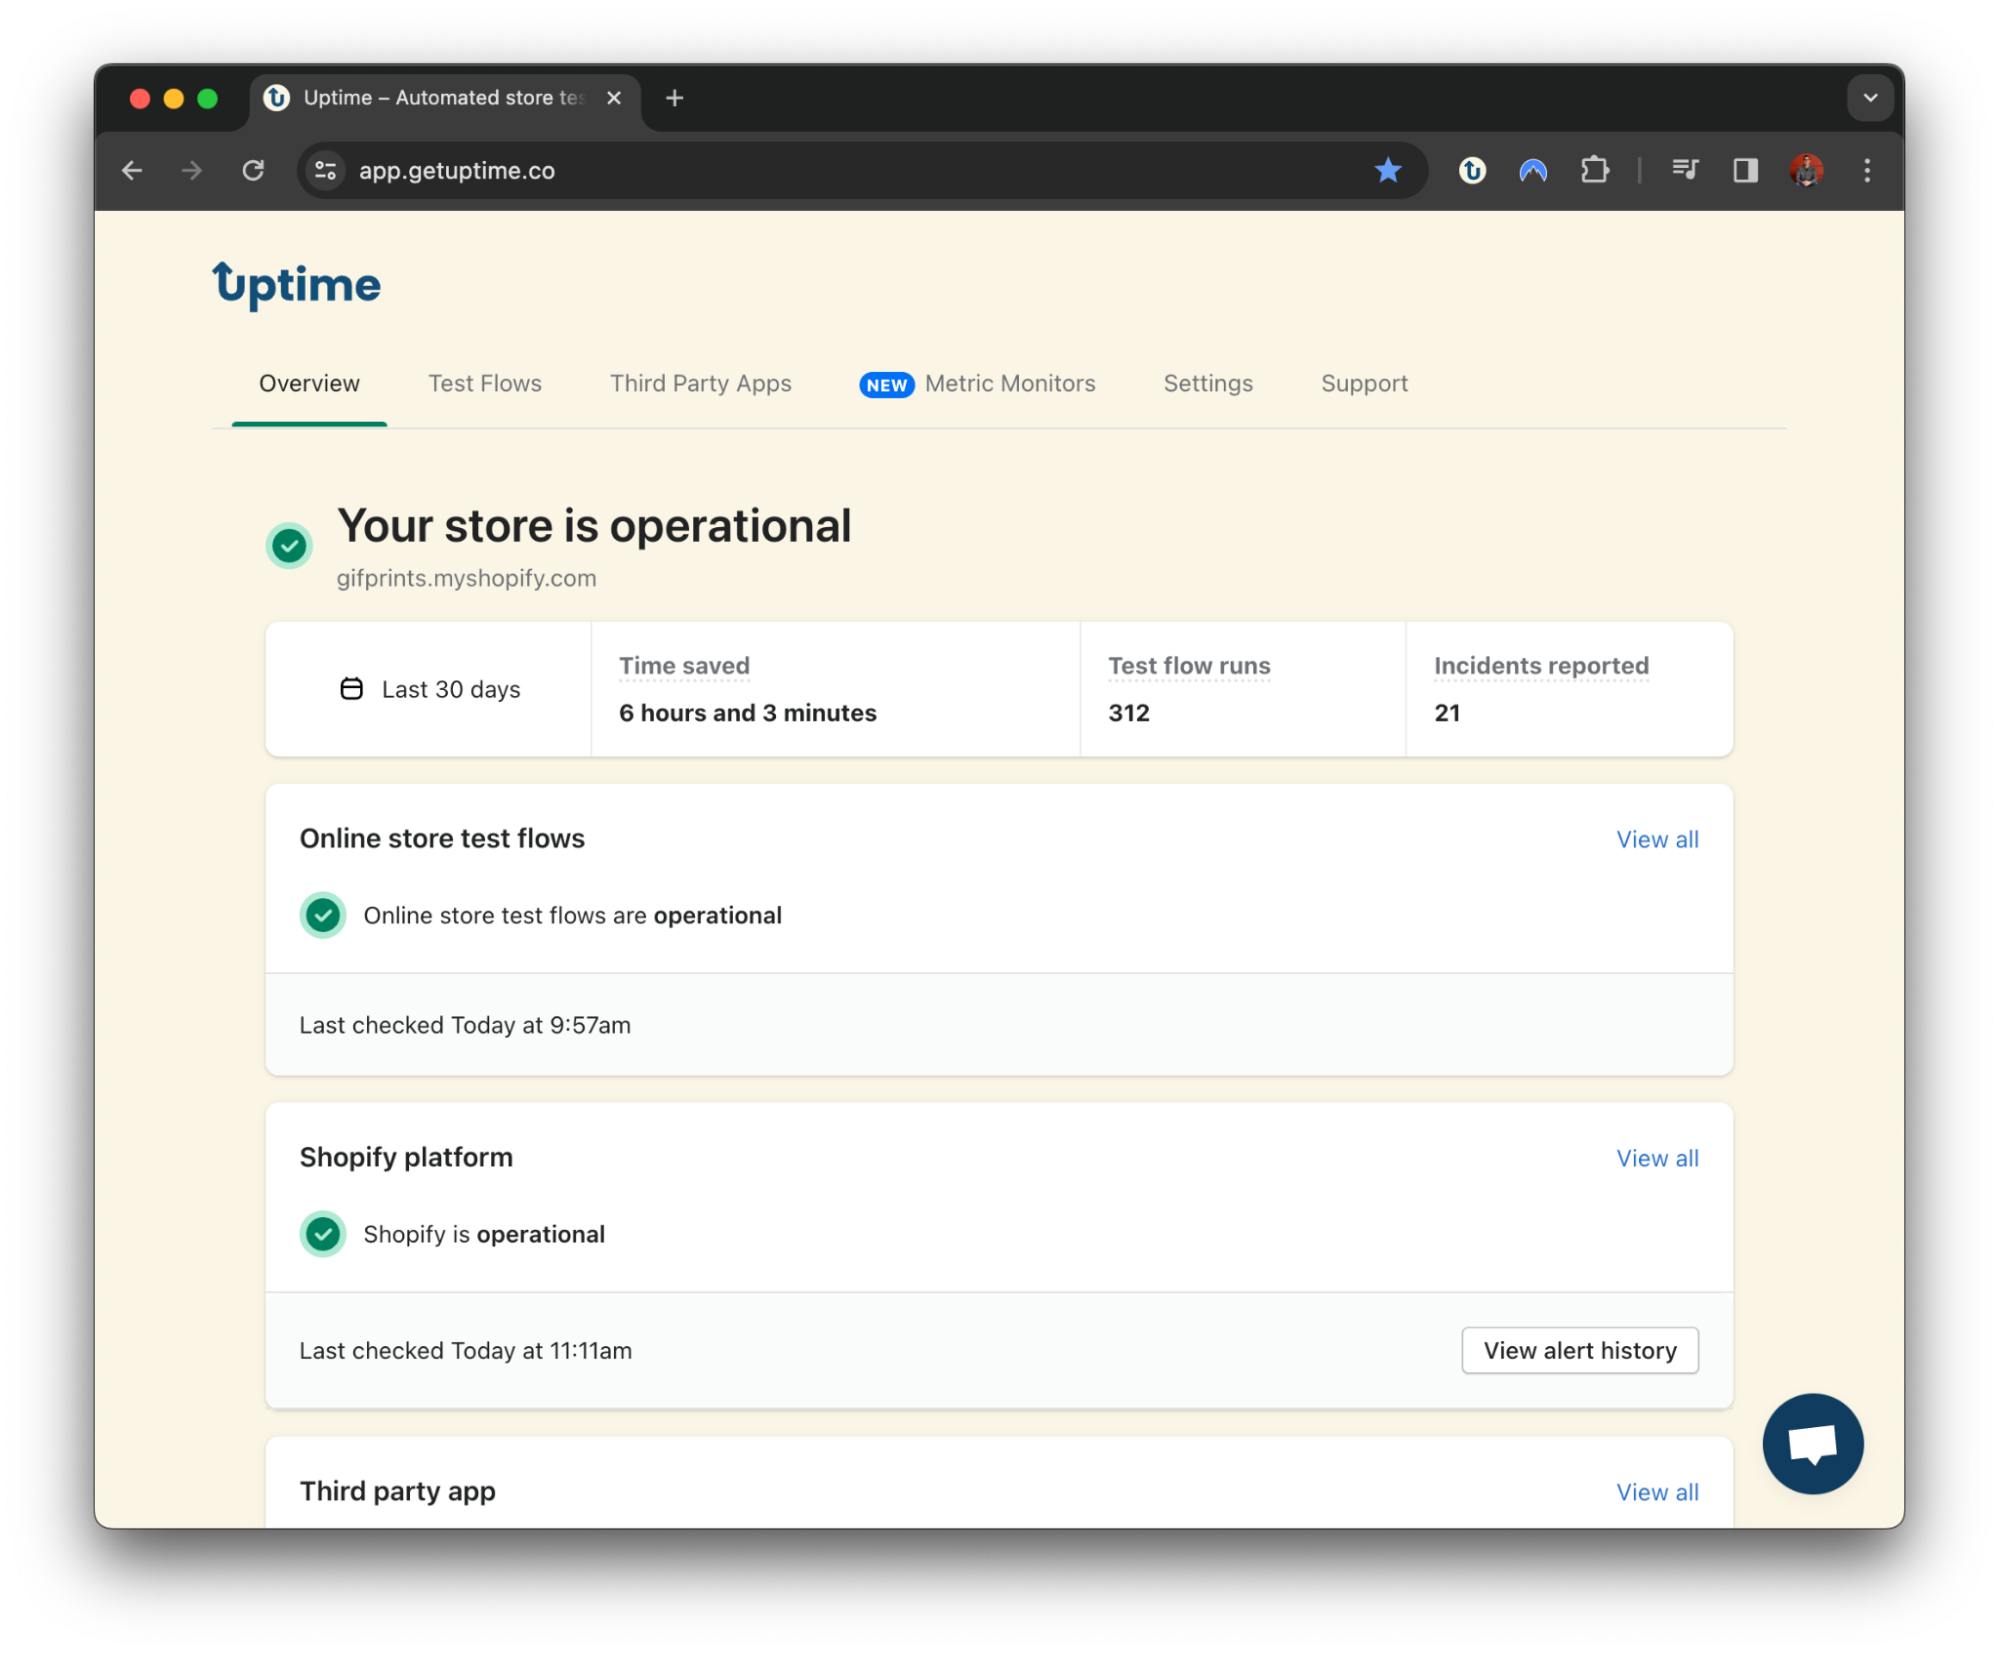
New: Uptime automated testing analytics on the Overview page
While you’re working hard to build and grow your business, Uptime is working in a handful of different ways in the background to ensure your store is functioning correctly.
Whether it’s your automated test flows, Shopify app or Shopify status page monitoring, or our newly introduced Metric Monitors – there’s a lot Uptime is keeping track of on a daily basis.
So, similar to some of the details we surface in our Weekly Summary emails, you can now view a 30-day summary of how Uptime is performing directly on the Uptime Overview page when you land in the app!
Overview analytics data
The data that we’re showcasing here on the Overview page is looking back at the previous 30 days. We hope that this will give you a clear picture of how your business has been performing from an uptime perspective over this timeframe.

Within the analytics card, you’ll see three pieces of important information listed – you can hover over the title of the data to view a description of what it’s tracking, but here’s a quick summary:
Time saved: The total cumulative time Uptime saved you from manually testing your online store.
Test flow runs: The number of times your automated test flows tested your online store.
Incidents reported: The total number of incidents reported across your automated tests, Shopify status, Third party app status, and Metric monitors.
Get a clearer picture of how Uptime is performing for your business
We hope this update will give you a clearer understanding of how Uptime is performing for your business, and putting in the work to protect your online store.
If your team wants to get some peace of mind, install the app now for free or book time with us and we can help you get started!


